Task 1: Set up the IMU
I connected the IMU to my board's Qwiic connector.
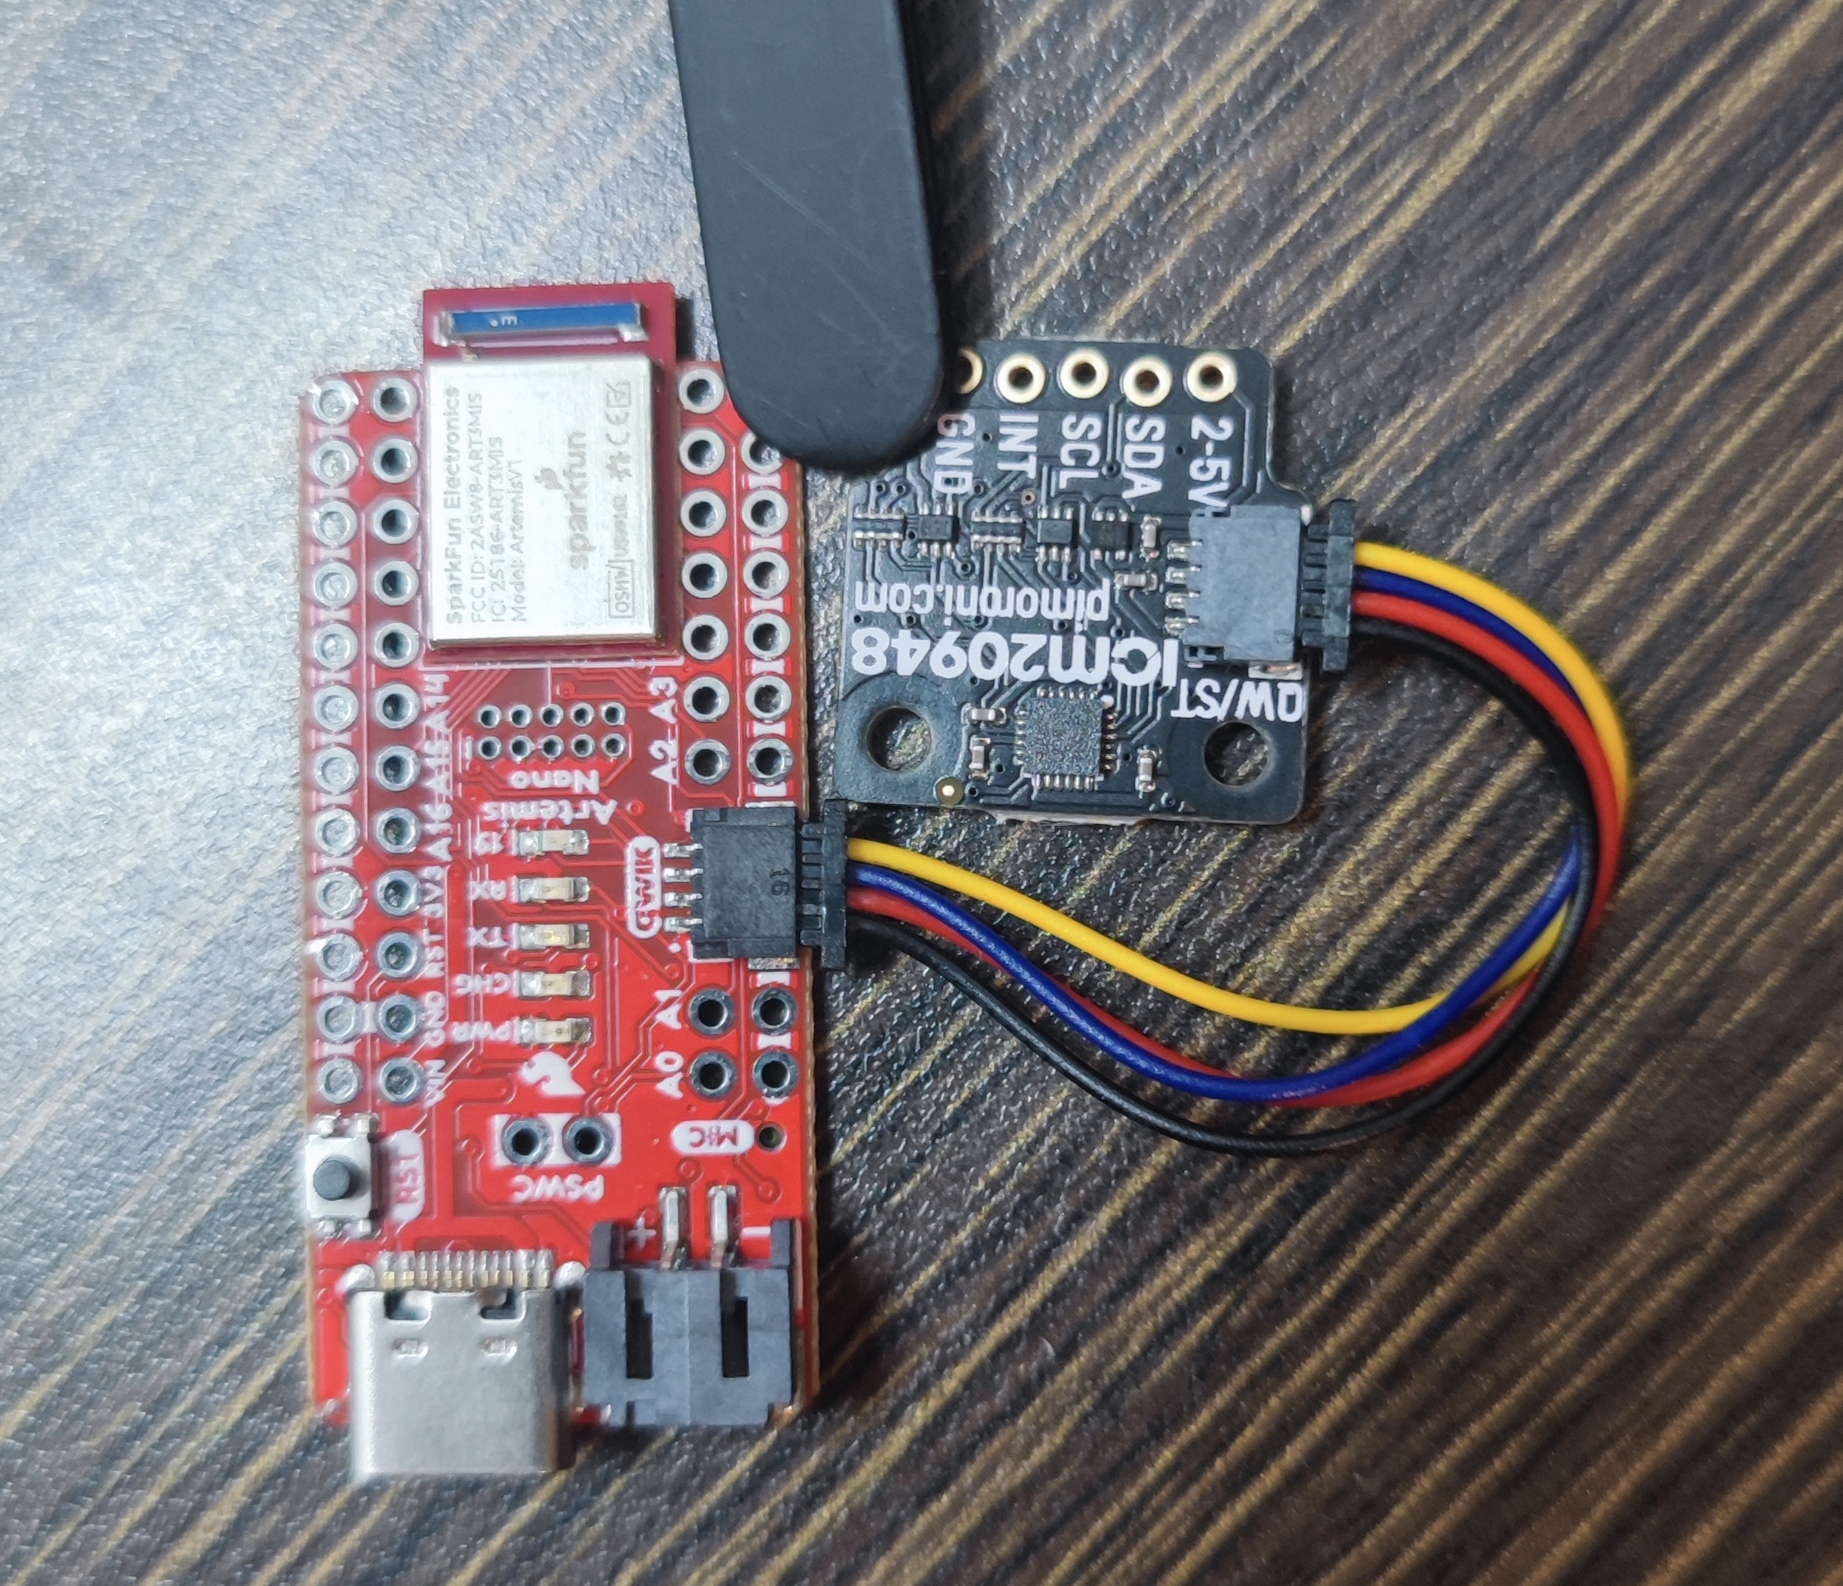
By installing the Arduino library 'SparkFun 9DOF IMU Breakout - ICM 20948', I can run the Example1_Basics. According to the Pimoromni, its I2C address can be 0x68/0x69(cut trace). The trace of the IMU I got is not cut, so the address should be 0x68. Since AD0_VAL defines as the value of the last bit of the I2C address, it should be 0 to makes it not be underflow.
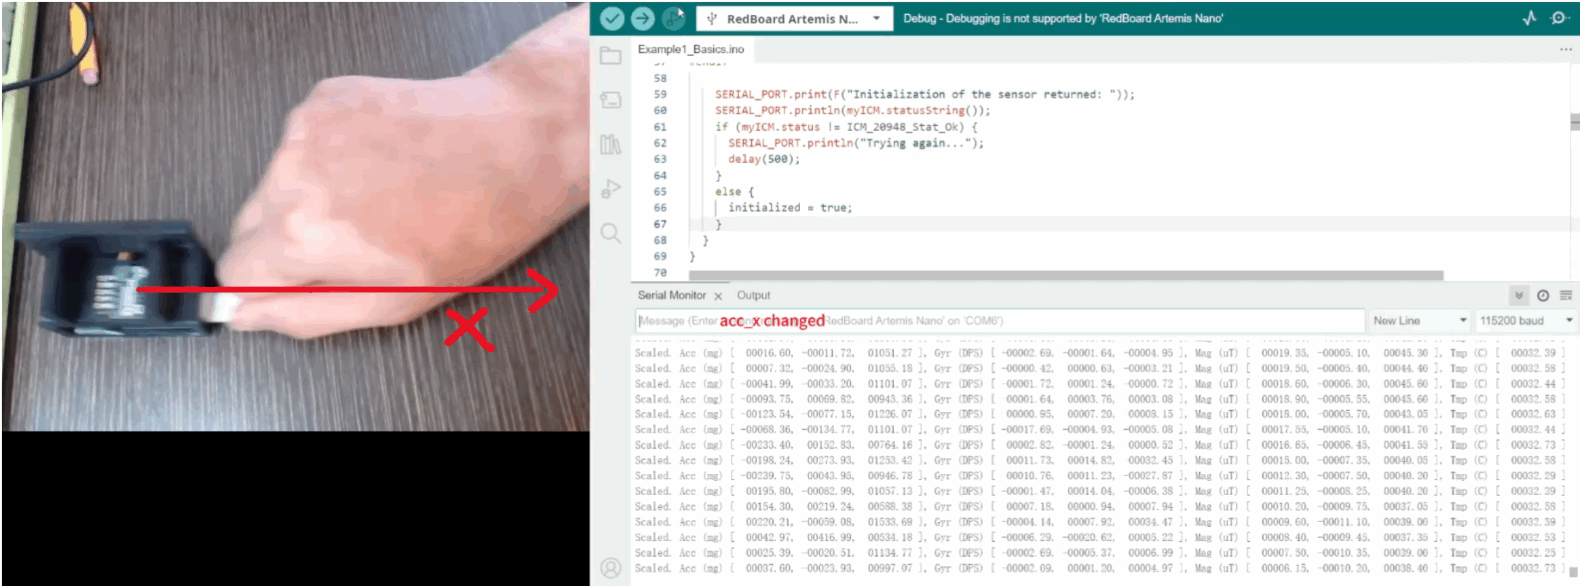
As shown in the video, the built-in LED blinks 3 times slowly on start-up to indicate the board is running.
When I rotate the board, the acceleration data changes mainly to show the direction of the gravity, as shown
in the above video and figure 3. As I rotate the IMU along the x-axis, the degree of acc_z gradually decreases
from +1g to 0g, while acc_y becomes +1g and acc_x stays the same. The gyroscope data changes to show the
rotational velocity. As I rotate faster, the value of gyro gets bigger and vice versa.
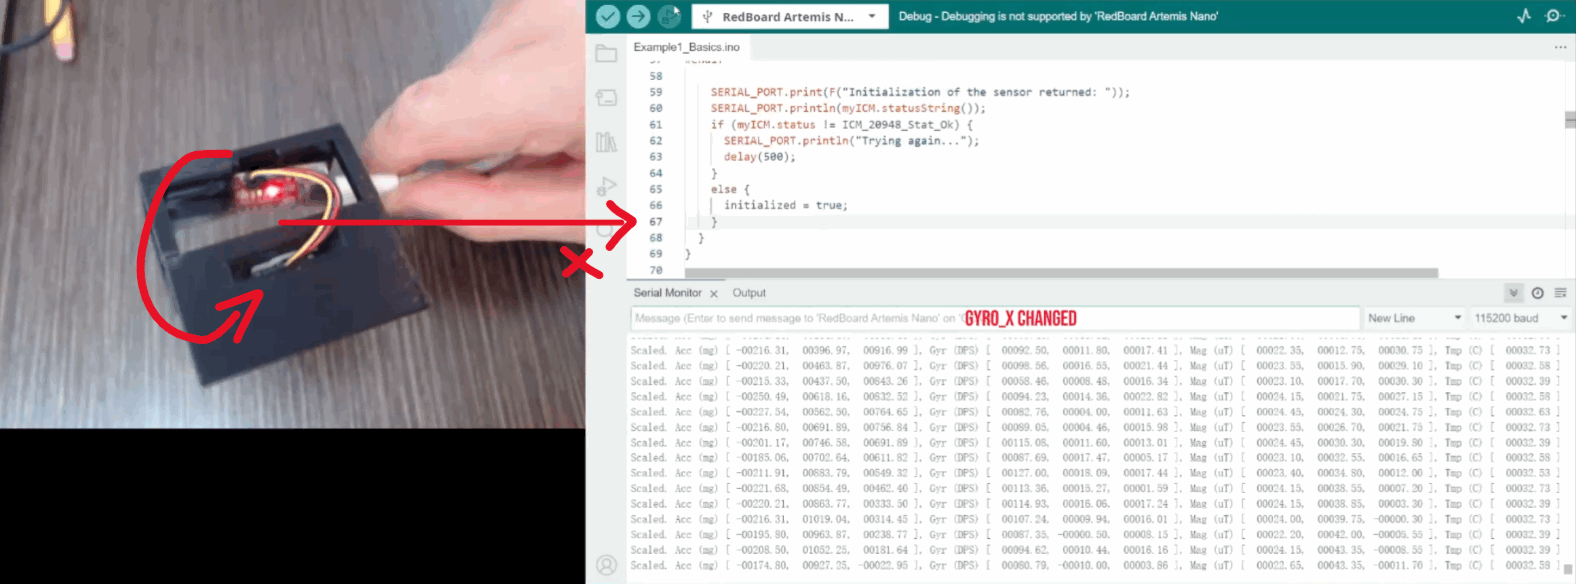
When I flip the board, the value of the accelerometer reverse along the axis of rotation. As shown in figure 4, when I flip the IMU along the x-axis, the degree of acc_z changes from +1g to -1g. The gyroscope shows rapid changes in angular rate. For example, the figure shows the rapid change in gyro_z.
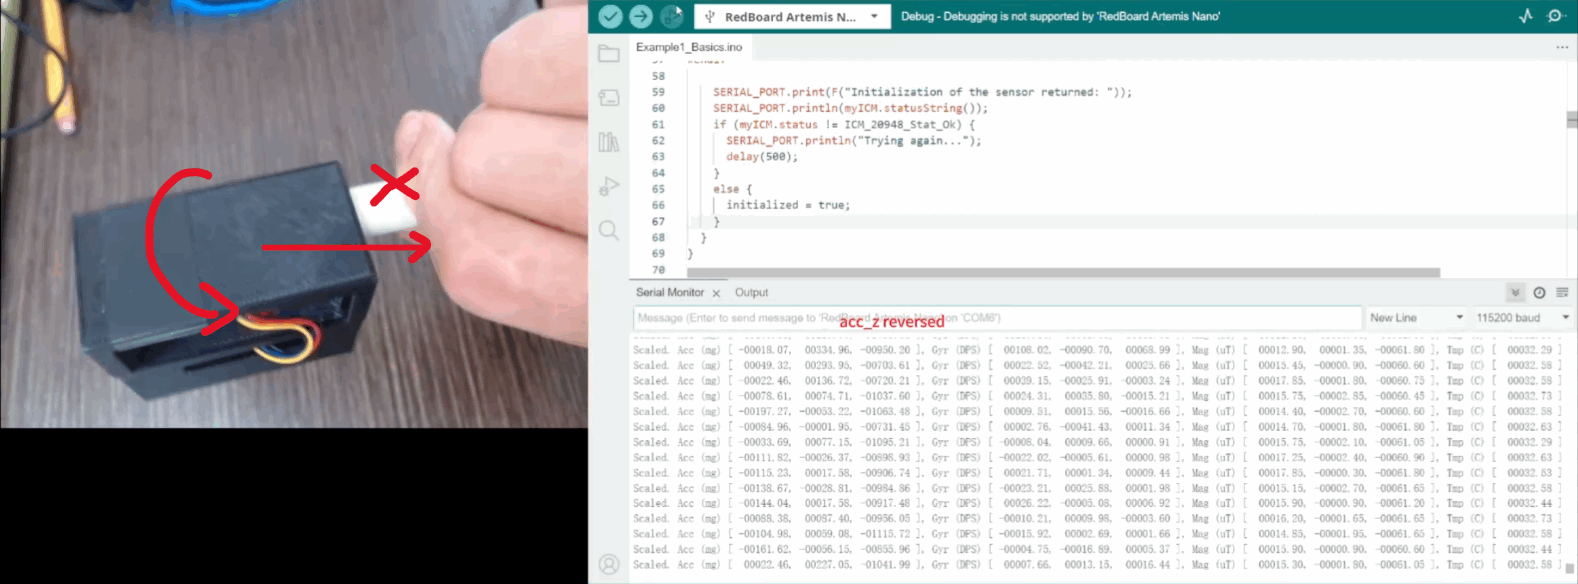
When I accelerate along a certain axis, the accelerometer reading in that axis gets bigger. The gyroscope reading doesn't change much because there is no rotating IMU. As shown in figure 5, I accelerate the IMU along the '-x-axis' and the acc_x gets bigger, while the gyro value changes only slightly, probably due to vibration and noise.
Task 2: Accelerometer
Convert to pitch and roll only from accelerometer data
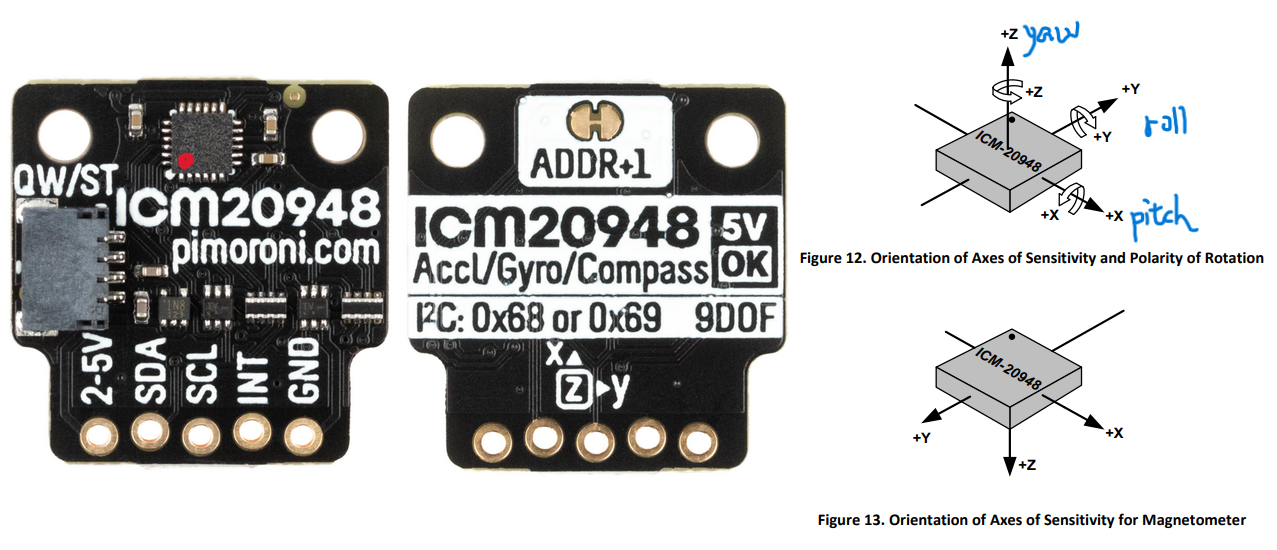
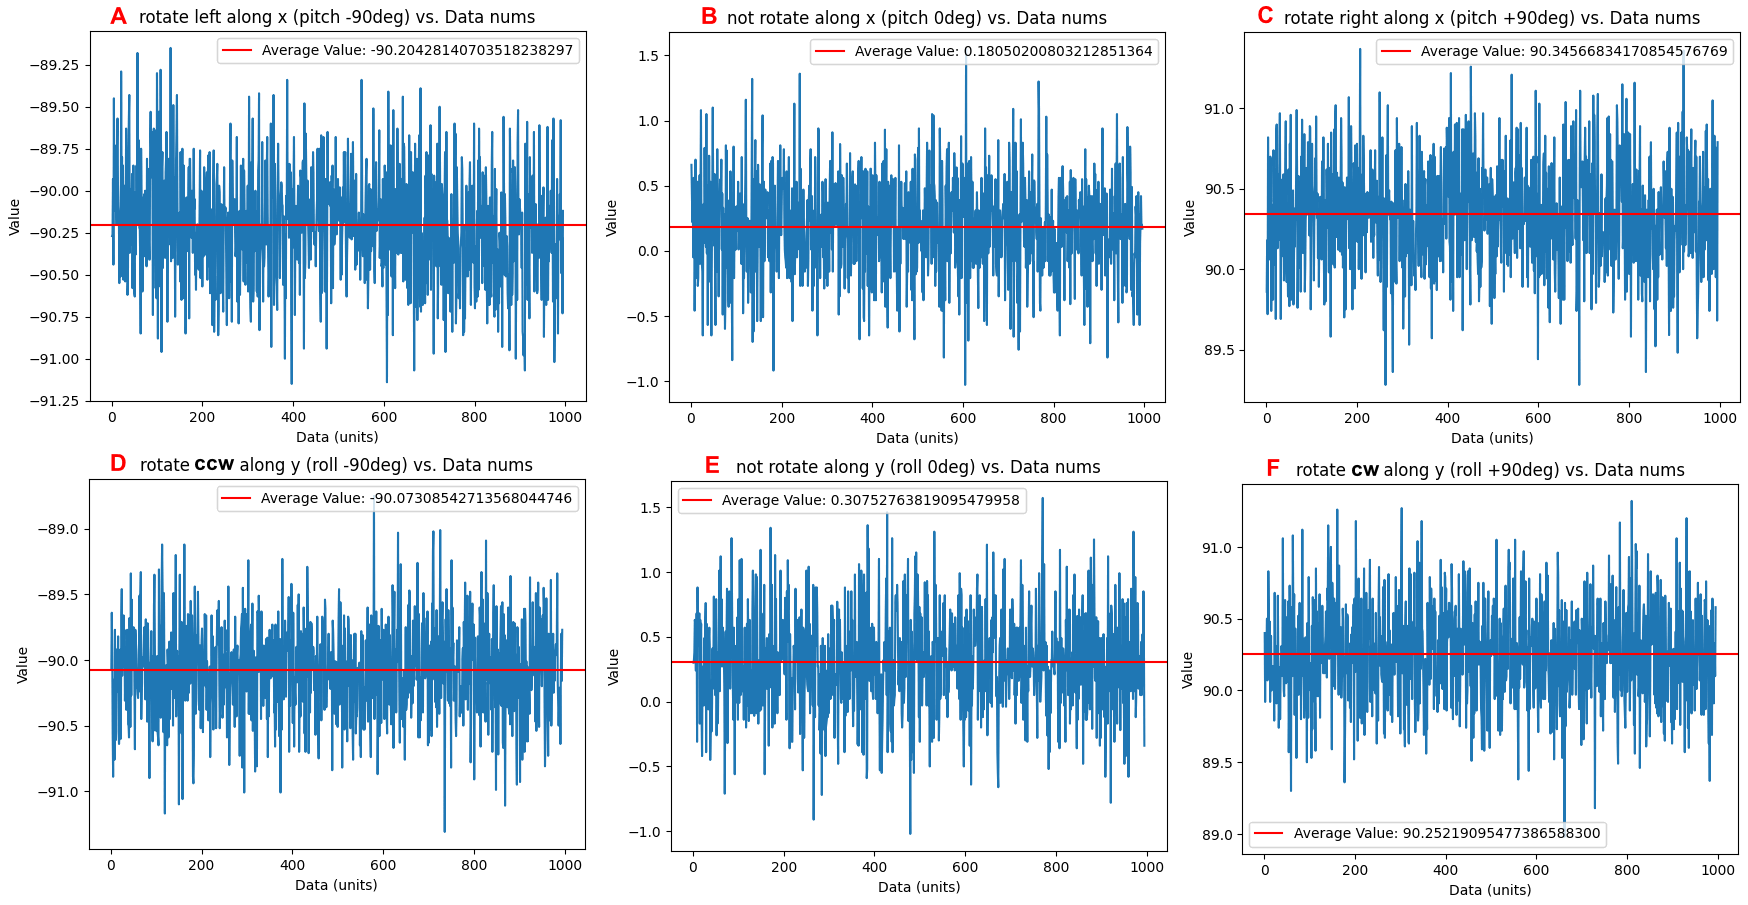
By using the formula: and the pitch and roll can be calculated. As the lecture, I define the clockwise direction around the X-axis as the positive pitch direction; the clockwise direction around the Y-axis as the positive roll direction; and the clockwise direction around the Z-axis as the positive yaw direction, as shown in Figure 2. I placed the imu at -90,0,90 degrees along the pitch/roll direction, recorded 996 data for each placement, plotted the following plots and calculated the mean and accuracy.
As shown in the left plot in the figure 5, the pitch value at -90 degree are -86.76916.
As shown in the middle plot in the figure 5, the pitch value at 0 degree are -0.00567.
As shown in the right plot in the figure 5, the pitch value at +90 degree are 87.02103.

As shown in the left plot in the figure 6, the roll value at -90 degree are -87.15554.
As shown in the middle plot in the figure 6, the roll value at 0 degree are -0.05848.
As shown in the right plot in the figure 6, the roll value at +90 degree are 86.37310.

The data and code for above calculation and plot is here.
I can use two-point calibration for pitch based on the points (-90, -86.76915747241726) and (90, 87.0210330992979). The result formula is
.
For roll, the two points I used are (-90, -87.1555421686747) and (90, 86.37309929789367). The result formula is
.
The following 6 plots in figure 7 show the pitch and roll value after two point calibration. The mean value of IMU's pitch and roll data are more closed to the correct value.
Fourier Transform & complementary low pass filter
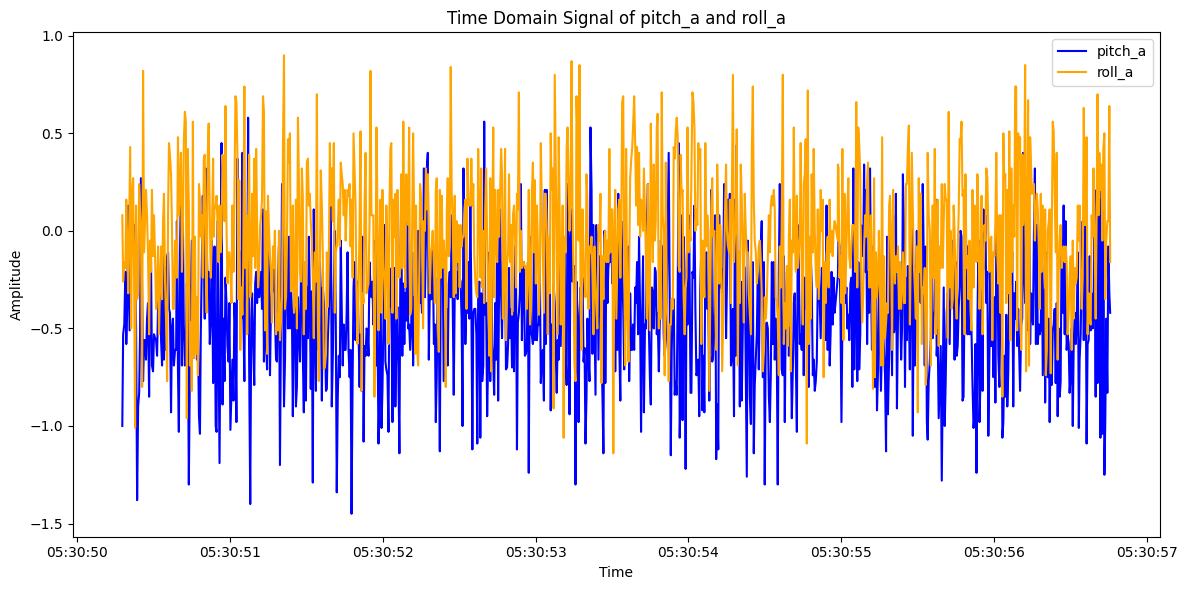
I collected 996 accelerometer data without large noise around, the data in time domain and in frequency domain plot are shown in the figure 8 and figure 9. Then, I collected 996 accelerometer data with large noise around(knock the table), the data in time domain and in frequency domain plot are shown in the figure 10 and figure 11. As you can see in the figure 11, the cutoff frequency should be around 40Hz.
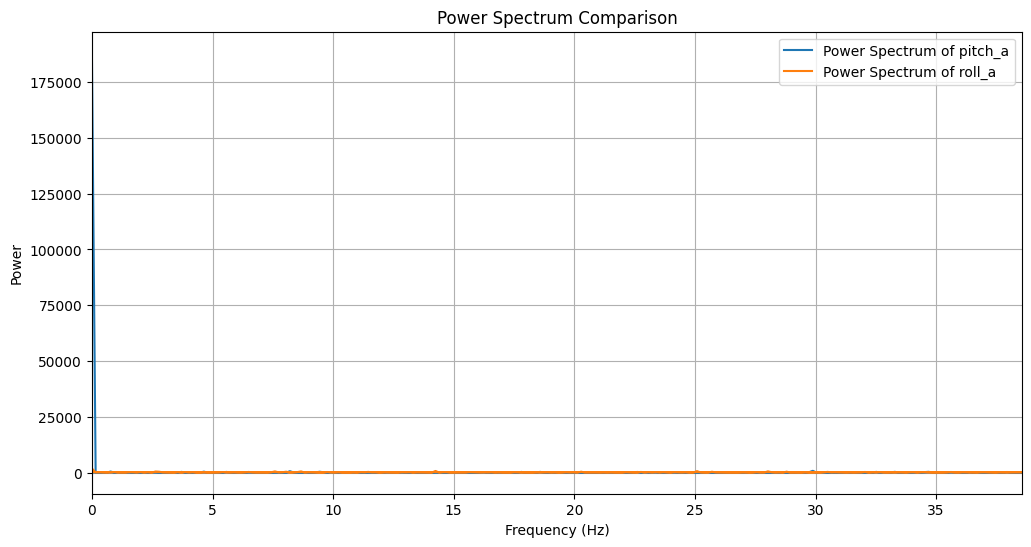
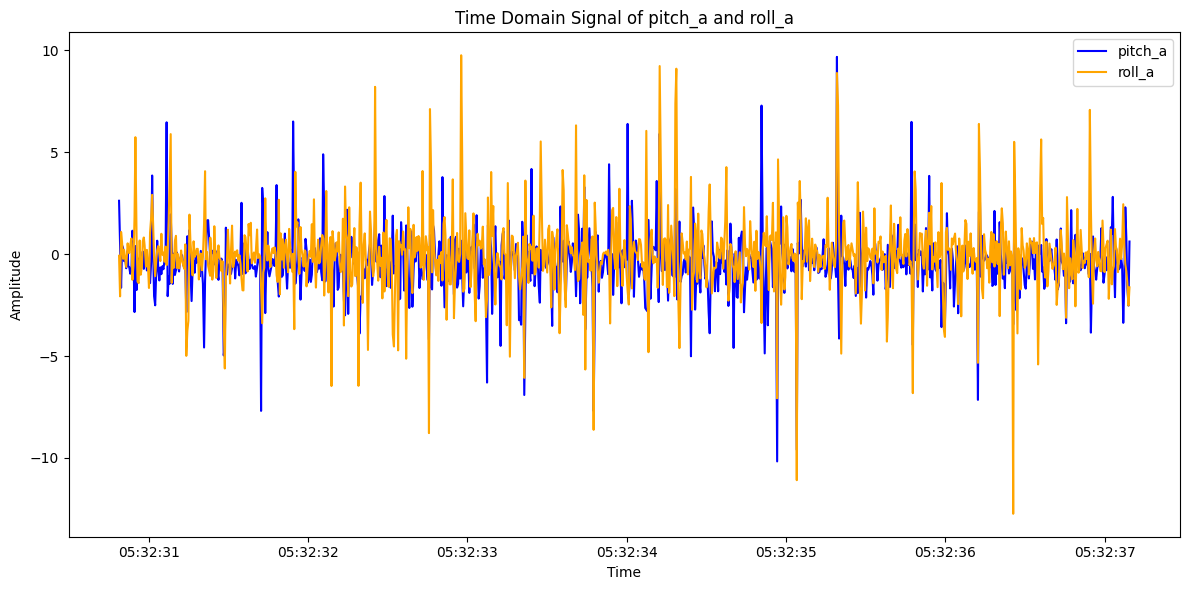
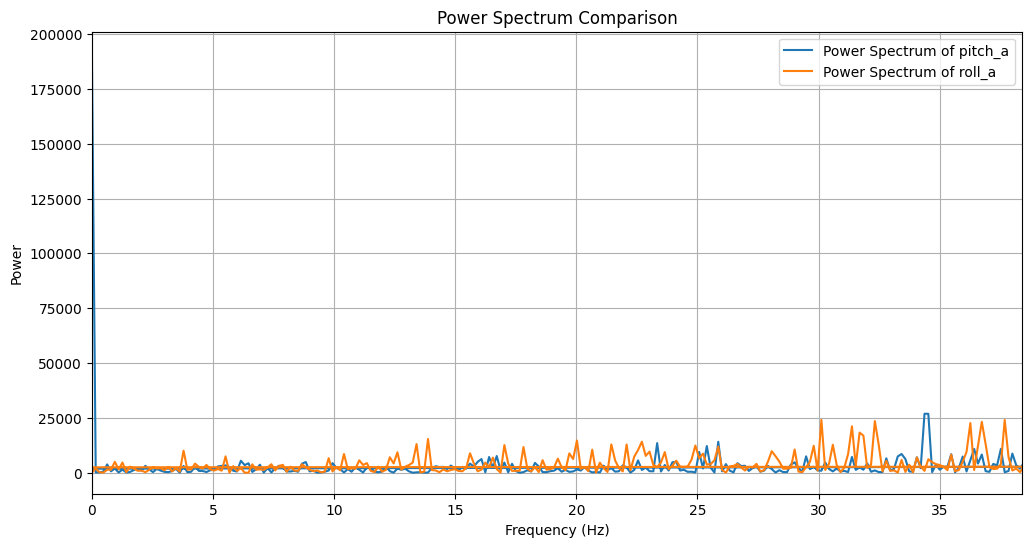
However, after applying the low pass filter as following code, there's little change in pitch and roll in the frequency domain, as shown in figure 13.
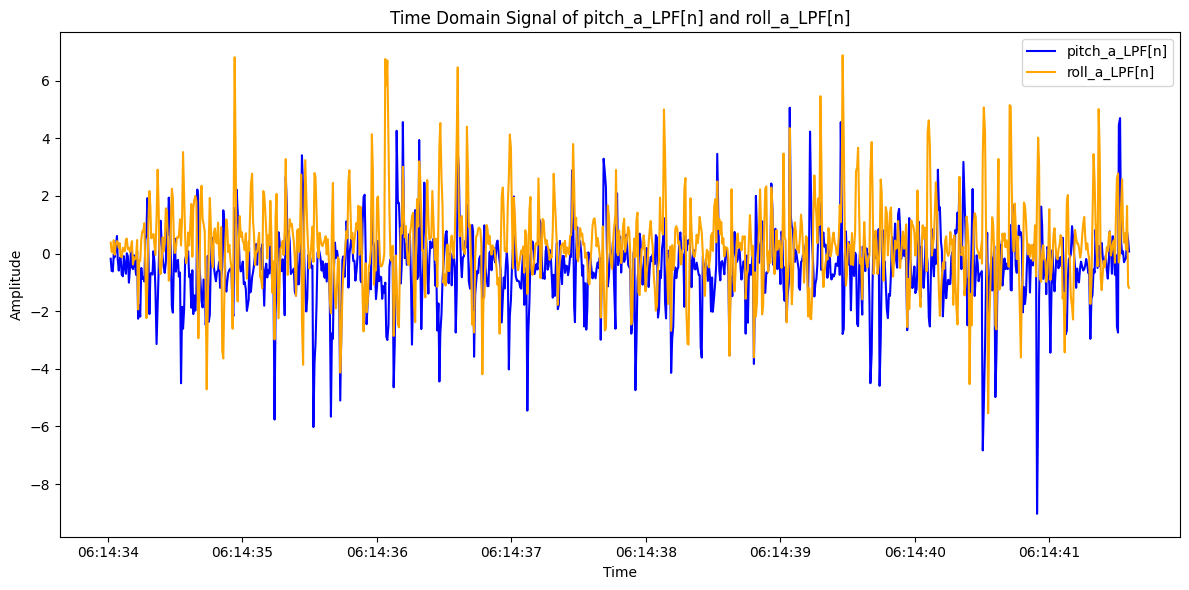
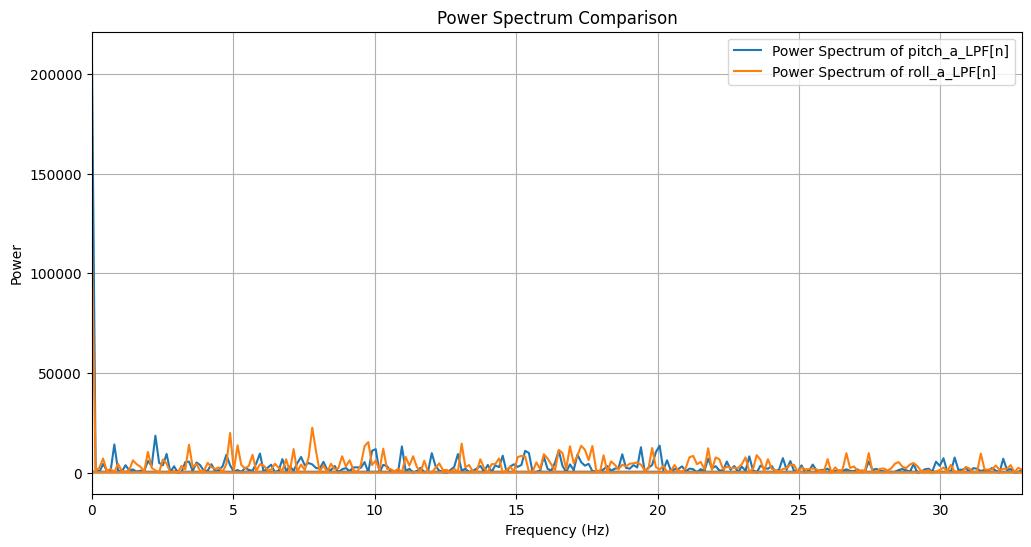
The code in python used to collect the serial data and analyze is shown in the following script.
Discussion on result
The reason the simple low-pass filter I wrote doesn't work is probably because there is a filter built into the chip, as shown in Figure 14. This image can be found in the ICM-20948 datasheet.

Gyroscope
Compute pitch, roll, and yaw from gyroscope data and complementary filter
By using the following code burned into the board, I can get the yaw_g, pitch_g, roll_g form the integration of gyroscope data. I also can get pitch, roll from complementary filter using gyroscope data and accelerometer data.
To show the accuracy and range of pitch_g calculated using only gyroscope data and pitch calculated using the complementary filter, I rotated imu along the x-axis and showed their values at {-90,0,90} degrees, as seen in Figure 15. At the beginning (left plot), pitch_g and pitch are overlapped, and at a stable 90 degrees, pitch_g = 85.72 and pitch = 86.5, the accuracy rate are 95.24% and 96.11%. However, due to the cumulative error caused by the integration, pitch_g is shifted more and more, which can be seen in the middle and right plots, where the blue line and the red line are gradually separating from each other. At a steady 0 degrees, pitch_g = -6.51 and pitch = 0.11, the absolute error are 6.51% and 0.11%. At a steady -90 degrees, pitch_g = -97.86 and pitch = -87.55, the accuracy rate are 91.27% and 97.28%.

To show the accuracy and range of roll_g calculated using only gyroscope data and roll calculated using the complementary filter, I rotated imu along the y-axis and showed their values at {-90,0,90} degrees, as seen in Figure 16. At a stable 90 degrees, roll_g = 105.72 and roll = 87.92, the accuracy rate are 72.53% and 97.69%. At a stable 0 degrees, roll_g = 16.06 and roll = 0.23, the absolute error are 16.06% and 0.23%. At a stable -90 degrees, roll_g = -72.26 and roll = -86.41, the accuracy rate are 80.29% and 96.01%.

To show the accuracy and range of yaw calculated using only gyroscope data, I rotated imu along the z-axis and showed their values at {-90,0,90} degrees, as seen in Figure 17. At a stable 90 degrees, roll_g = 107.6, the accuracy rate are 80.44%. At a stable 0 degrees, roll_g = 19.69, the absolute error are 19.69%. At a stable -90 degrees, roll_g = -69.3, the accuracy rate are 77.00%.

The pitch, roll, and yaw values from the integration of gyroscope data only are gradually shifted over time, even at rest, as seen in Figure 18. However, the pitch and roll from the complementary filter does not be affected. They are not susceptible to drift or quick vibrations.
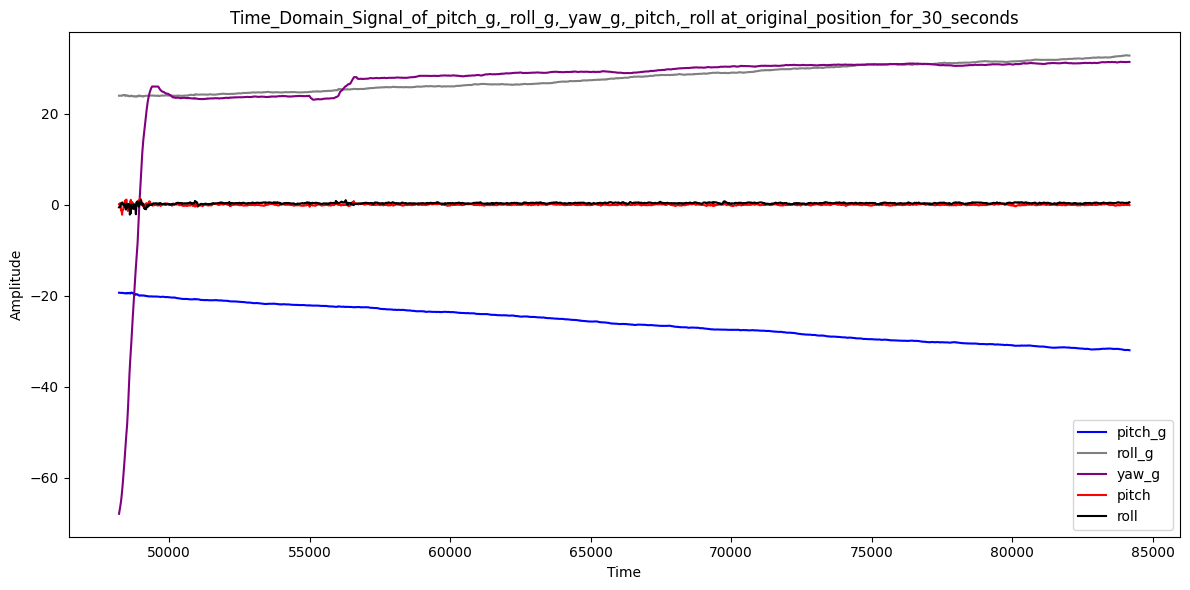
By using the following code, I changed the frequency from 83.33Hz to 20Hz. Then, I did the same operation of rotation to my IMU. As shwon in Figure 18, a lower frequency caused the drift be bigger, and the accuracy rate of pitch_g, roll_g, yaw_g, pitch, and roll be lower since the dy in the integral becomes larger, and each sampling of gyro and acce values had a greater impact on the results.
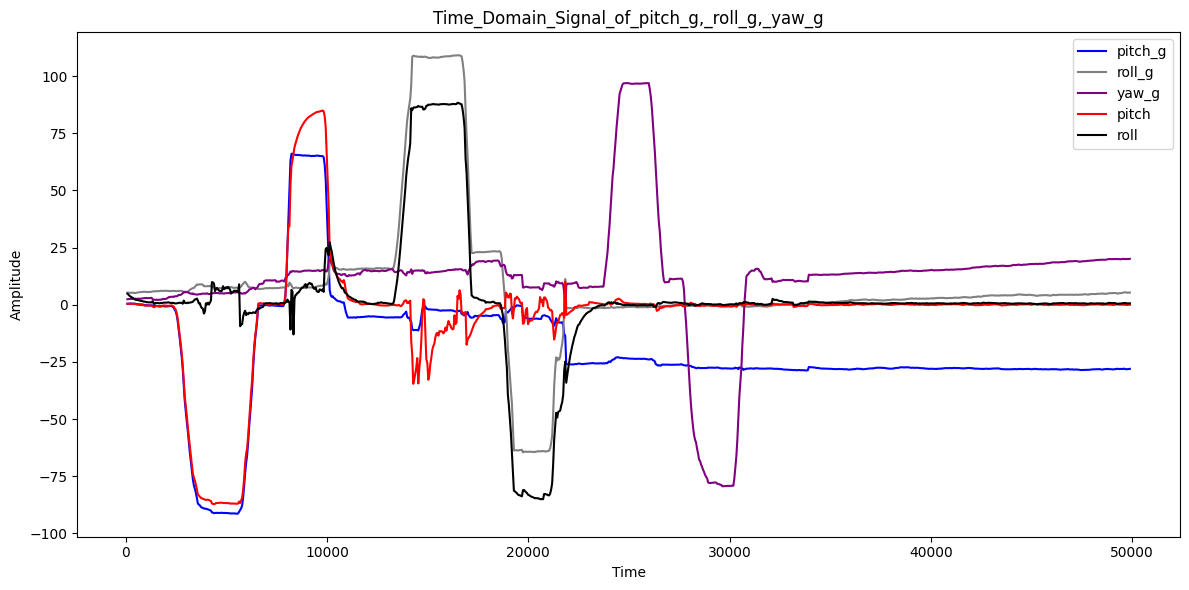
As shown in the following video, the range of the complementary filter is -180 degrees to 180 degrees since when I rotate the IMU along x/y axis more than 180 degrees, the value will change to -180 degrees. This brings up some design considerations, as we need to avoid applying this filter to devices with large steering ranges, or needing to do extra work on the formulas, or on the subsequent analysis of the data in this case.
Sample Data
Speed of sampling discussion
To speed up the execution of the main loop, I burned following code into board, I got following feedback:
First DataPoint - timestamp: 81, floats[0]: -9.765625
Last DataPoint - timestamp: 7417, floats[0]: -13.671875
Time elapsed: 7336
Data recorded: 3000
Frequency: 408.94
NOT READY TIMES: 42
The spped of the new way used to sample data is 408.94Hz.
The main loop on the Artemis runs faster than the IMU produces new values since in the main loop, the times of myICM.dataReady() is false is 42.
Collect and store time-stamped IMU data in arrays
As shown in the above code, the size of the array 'dataPoints' stored the IMU data is the flag being used to stop the operation of store new IMU data.
In the array used to store IMU data, each element in it is 9 floats and 1 unsigned int string, including 9 imu data and 1 time stamp. I choose to use
this struct to stroe data to increase the sampling rate.
Since the memory of the Artemis is 384KB, and I uses struct of 40 bytes = 4bytes * 9 floats + 4bytes*1 unsigned long. If the sampling
rate is 408.94Hz, the Artemis can store 384 * 1024 / 40 / 408.94 = 24.04 seconds.
Then, I combined 1 IMU data (9 floats + 1 unsigned long) to be a string in csv format, and send to computer via BLE. Related codes are shown following.
Discussion
I use a large struct array to store the accelerometer and gyroscope data to get the highest sampling rate. I chose to use this way to store the data because most IMU data is of the floating point type, this structure makes reading the data easy to understand, and it uses the least amount of memory. When sending the data to the computer, I reconstructed the data into a string consisting of 9 IMU data + 1 timestamp. This way, it is sent data faster than if all the floating point type data was sent individually.
Collection and send via BLE
The following video shows the board collects 5s IMU data and sends to the computer via BLE.
Record a stunt
This is the video of playing the car without Artemis. Currently, since I don't have the Artemis connected to a battery, the Artemis is not able to run and collect IMU data without being connected to a computer.