Estimate drag and momentum
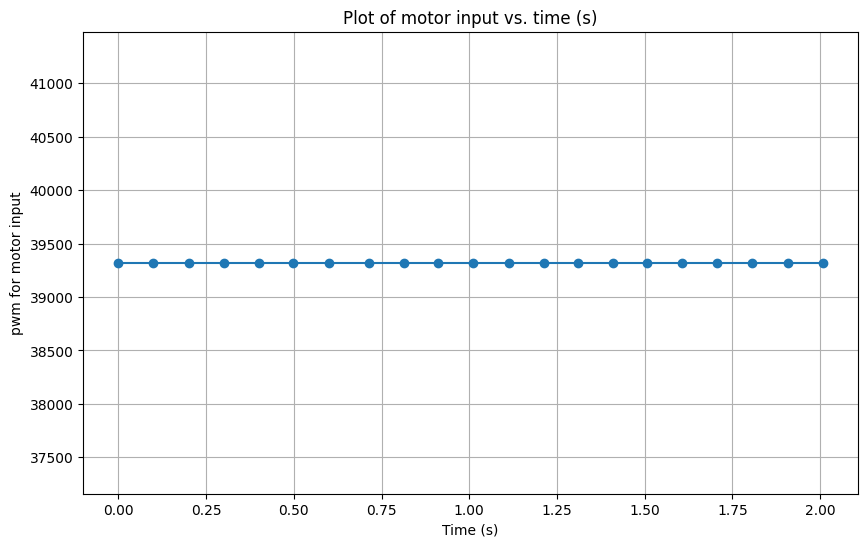
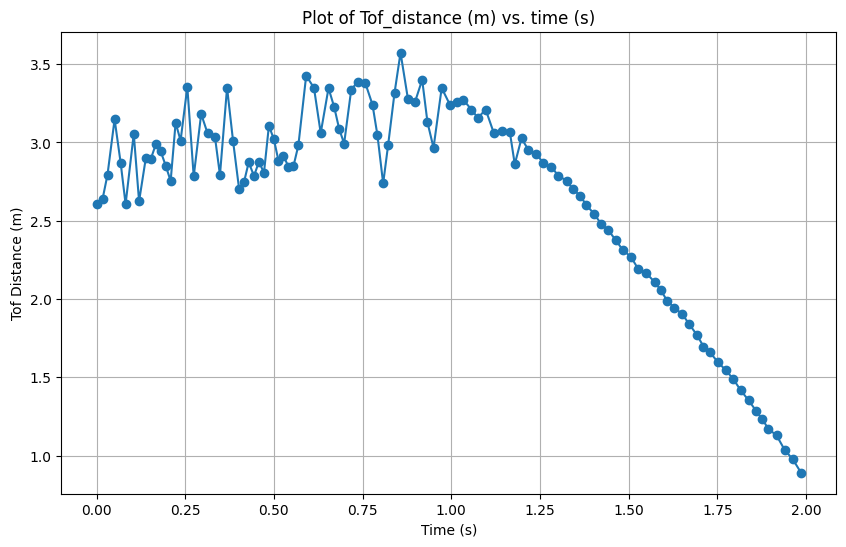
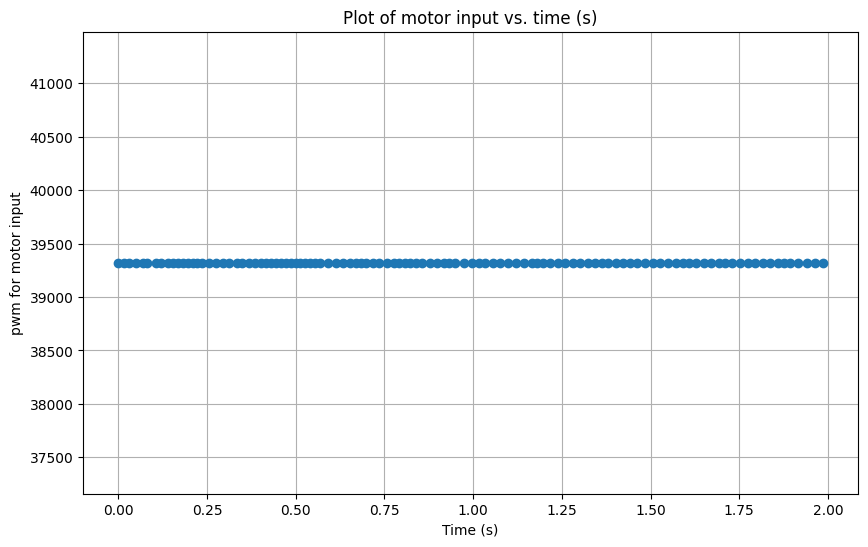
To build the state space model of the system, I first set the car's speed to 60%(about 39321) of max speed(65535). To keep the car moving in a straight line, the right motor input is 37095 and the left motor input is 39321. Then, I made the car drive toward the wall at this speed for 2 seconds. The following are the related plots.
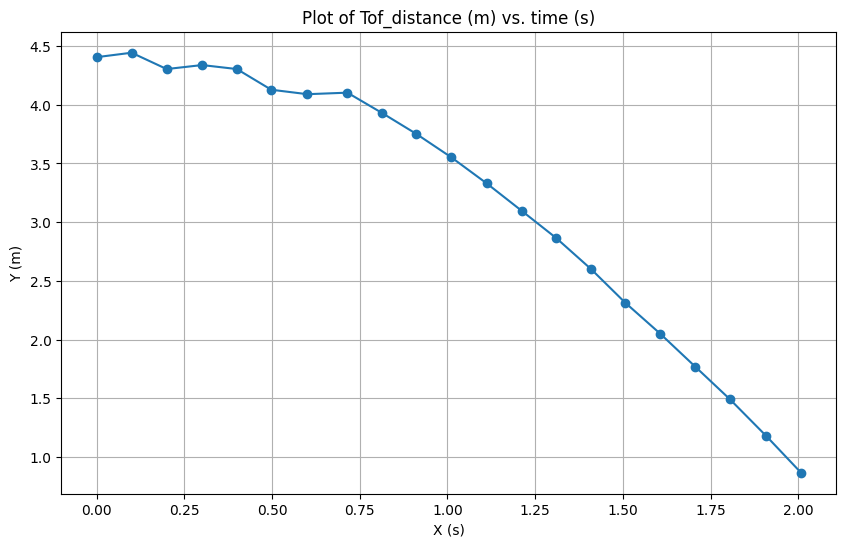
When the time budget was 20ms, I passed the same command to the car and recorded the data.
All data are recorded in a CSV for future use.
As shown in Figure 5, the measurements generated from the 20 ms time budget fluctuate too much. Thus, I will build a Kalman filter using
the data generated from the 50 ms time budget.
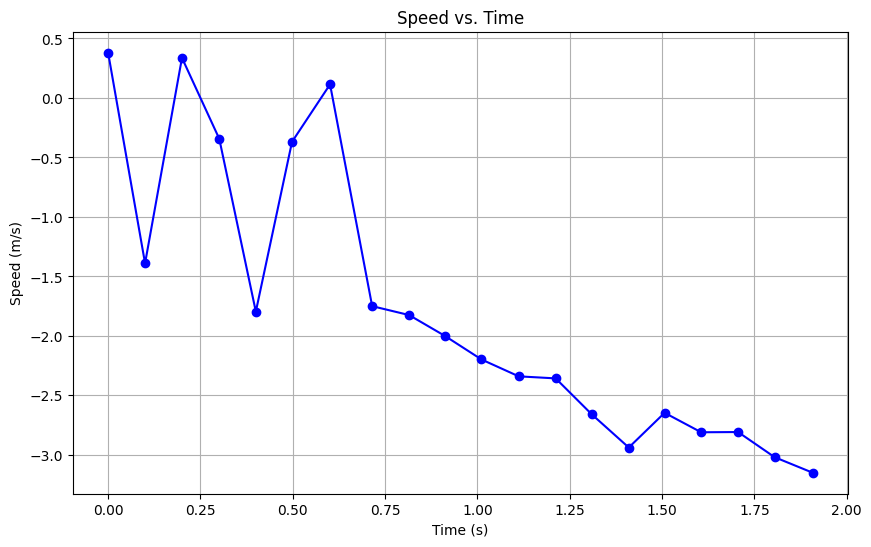
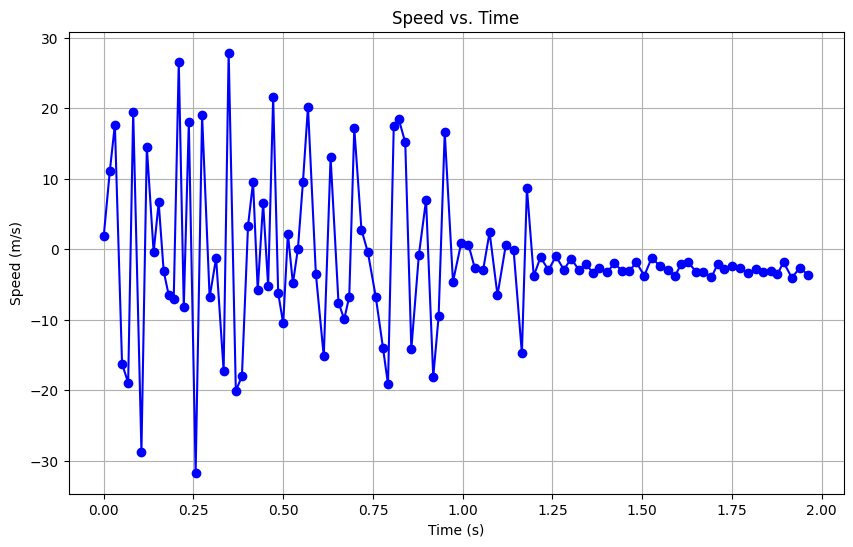
According to the figure 2, the speed at steady state is -2.86m/sec.
The 90% rise time is 1.1475s(from 0.625s to 1.9s) and the speed at this 90% rise time is 2.8m/sec.
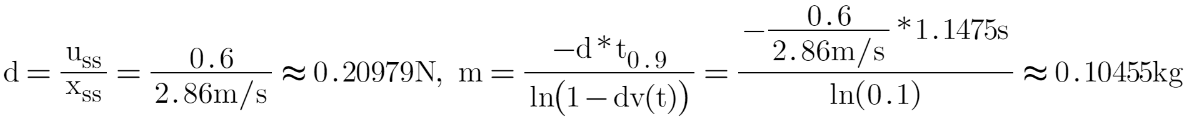
The car drived at PWM = 39321, which is 39321/65535 = 0.6 of max speed. Thus, .
According to the formulas, I can calculate d and m.
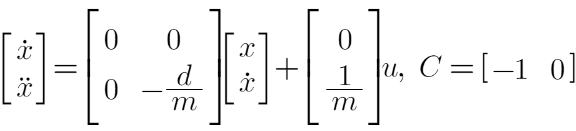
Thus, I can build the state space equation:
Initialize Kalman Filter (Python)
According to above value calculated, the matrix A, B, and C in the state space equation are
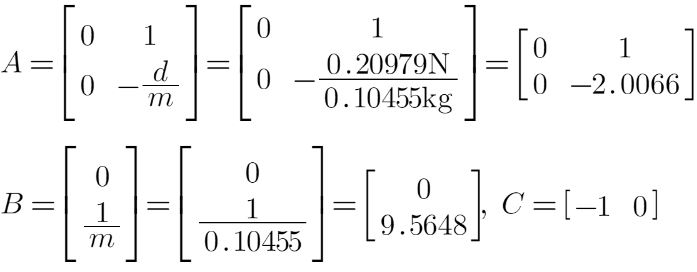
Thus, I initialize my Kalman filter in python as following:
After discretize the matrices by using sampling time 110ms, the Ad and Bd are:
The state vector 'x' and the noise covariance matrices of process and sensor are:
Implement Kalman Filter
Since the PWM, ToF, and Timing data received from Artemis via BLE are stored in a CSV by using the following code:
I can re-read the data for the Kalman Filter.
I implemented my kalman filter using the code provided by instruction as the following.
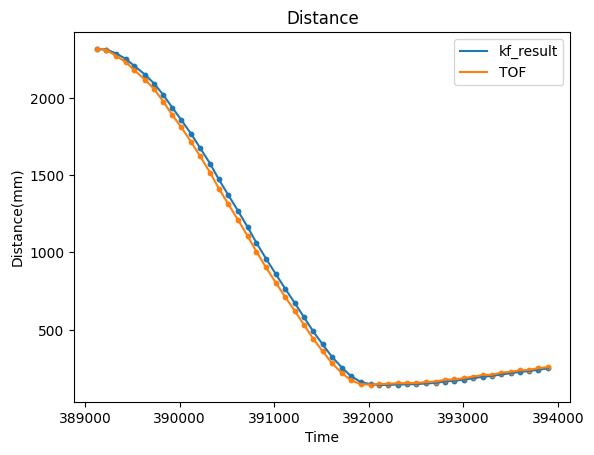
For the following test on lab7 data, I set sigma1 to 20, sigma2 to 40, and sigma3 to 20. You can see that the kf_result deviates from the tof a bit, and becomes smooth. The reason for the deviation from tof is that I think the noise of the sensor is 20mm. I also balanced the values of sigma1 and sigma2 to make the prediction more realistic.
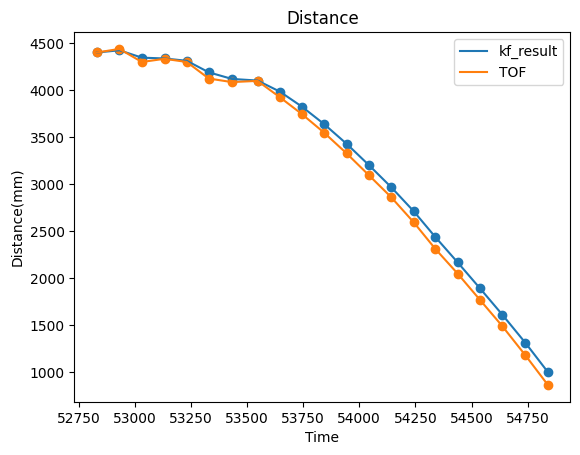
By changing the u to the time-varying motor input and delta_t to 99.33ms, I then applied kalman filter to the lab5 data. As you can see, the filter is robust.
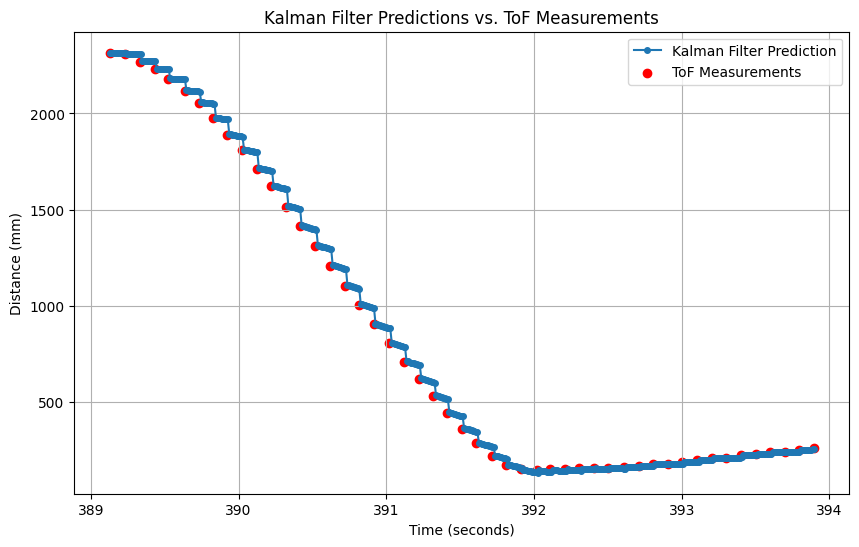
Run Kalman filter at a faster frequency than the ToF readings
In order to run the filter at a faster frequency, I changed Delta_T and the prediction method as shown in the code:
As shown in the figure below, there will be 9 more kf prediction points between the two tof readings. This will make the control more stable.